![]() 6.4 ADDING A RISK-FREE SECURITY
6.4 ADDING A RISK-FREE SECURITY
|
Figure 6.1 |
|
Adding a Risk-Free Asset |
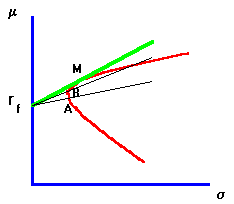
Government or Treasury securities are considered to have zero default risk. There are Treasuries for all different maturities, so it is reasonable to assume that you can find one with the same maturity as your investment horizon. Such a security can be thought of as a risk-free asset whose return has zero variance. This corresponds to the point r
f on the m-axis in Figure 6.1, because the risk-free asset does not have any variance.Suppose you can borrow or lend at this risk-free rate. This alters the investment opportunities available to you, as you can now combine the risk-free asset with risky assets.
Consider a point A in Figure 6.1. This corresponds to a portfolio that has an expected return of E(r
A) and a standard deviation of sA. However, we can obtain the same expected return with a lower variance by combining the portfolio consisting of the point B in the above figure. Here, you would be investing a in rf and (1 - a) in B.What is the expected return and risk from this investment?
The expected return is
arf + (1-a)*E(rB). The portfolio risk is generally not the weighted average of the two standard deviations, but because the risk-free security has zero variance and zero covariance with any other security, the portfolio risk reduces to (1-a)sB.By choosing
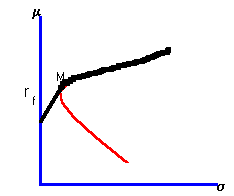
a appropriately we can thus achieve the same return at less risk. Continuing in this way, we find that the best we can possibly do is to combine the risk-free asset with the point shown as M on the figure. This leads to a new efficient frontier, commonly called the capital market line (CML). The capital market line is the line from rf through M. Point M is called the market portfolio, and you will see why in the chapter on market equilibrium. If borrowing is allowed at this risk-free rate, then the CML extends past the point M. If borrowing is prohibited at the risk-free rate, then the CML will stop at M and continue along the old efficient frontier as depicted in the heavier line in Figure 6.2.|
Figure 6.2 |
|
No Borrowing at the Risk-Free Rate |
A numerical example of how a risk-free asset alters the investment opportunity set is provided in topic 6.5, Three-Firm Case: Adding a Risk-Free Asset.
previous topic
next topic
(C) Copyright 1999, OS Financial Trading System