![]() 7.11 EMPIRICAL TESTS OF THE CAPM
7.11 EMPIRICAL TESTS OF THE CAPM
Most empirical tests of the capital asset pricing model concentrate on the SML equation
![]()
The tests take a representative value-weighted index, such as the S&P 500 index, as the market portfolio, and then see whether the historical average return on a security can be explained by the equation. Two classic studies are Black, Jensen, and Scholes (1972) and Fama and MacBeth (1974). A more recent study is by Fama and French (1992). All these studies focus on whether beta alone can explain the historical average returns on portfolios. We discuss each of these studies and also look at a powerful critique of all empirical tests of the CAPM due to Roll (1977).
The Black-Jensen-Scholes Study (1972)
Black, Jensen, and Scholes use the equally-weighted portfolio of all stocks traded on the New York Stock Exchange as their proxy for the market portfolio. For ten different portfolios, they calculate the relationship between the average monthly return on the portfolios and the betas of the portfolios between 1926 and 1965. They find a remarkably close relationship between beta and the monthly returns. The following graph gives an example of their results:
Figure 7.8
Monthly Returns as a Function of
b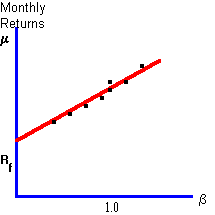
The prediction of linearity is not rejected in this study, although the intercept is significantly greater than the average risk-free rate of return over the period they study.
The Fama-MacBeth Study (1974)
Fama and MacBeth examine stocks traded on the NYSE between 1926 and 1965 and take as their proxy for the market portfolio an equally weighted portfolio of all NYSE stocks. They focus on two implications of CAPM:
i) That the relationship between the expected return and the beta of a portfolio is linear
ii) That the expected return is determined purely by a portfolio's beta, and not by the "residual variance" of the portfolio.
After estimating betas and historical average returns, they run the following regressions:
![]()
![]()
where for N stocks in portfolio p, RV is the average of the residual variance of each security included in p:
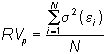
If the SML equation holds,
a0 should equal the average risk-free interest rate, a1 should be the "excess return on the market," and a2 and a3 should equal zero.The estimates obtained by Fama and MacBeth support these predictions;
a2 and a3 are not significantly different from zero, while a0, and a1 are.The Fama-French Study
In this study portfolio groups of similar betas and size are constructed from all non-financial stocks traded on the NYSE, NASDAQ and AMEX between 1963 and 1990. These groups are then compared to groupings based on size alone. For the latter, CAPM worked well, but for the former, it performed poorly.
Fama and French conclude that firm size and other accounting ratios are better predictors of observed returns than beta.
Roll's Critique
Roll (1977) has criticized all attempts to test the capital asset pricing model. You may recall from Chapter 6, where we discuss mean-variance efficient portfolios, how we derived the "beta" or security market line equation
![]()
This derivation did not require us to make any assumptions about equilibrium (i.e., supply = demand) , or, in fact, about any investor behavior at all. The equation is obtained simply as a by-product of the mathematical exercise that produces the efficient frontier.
This means that whenever we have a set of securities, a covariance matrix, and the expected returns, the equation holds, quite independently of how securities are actually priced in the market.
This observation is the basis of Roll's critique of tests of the CAPM; that is, a test of whether this equation holds in practice does not tell you anything about whether securities are priced according to market equilibrium in a mean-variance framework.
So exactly what are the implications of equilibrium? You may recall that after we obtained the capital market line, we derived the two-fund separation theorem and finally interpreted the market portfolio as a value-weighted index of all risky securities.
Both of these are implications of market equilibrium (or at least of expected utility maximization). They require that all investors face the same efficient set.
Together, they imply that the market portfolio is an efficient portfolio, so a testable implication of the CAPM is that the observed market portfolio (i.e., the value-weighted index of all risky assets in the world) is efficient. Roll (1977) argues that this is the only testable implication. Yet testing it is close to impossible, as tests must include all assets available to investors.
previous topic
next topic
(C) Copyright 1999, OS Financial Trading System